MapOps · Expansion Workspace · Tourism & local economic development · NSW

Map demand concentration. Invest where it compounds.

Regional demand mapping and hospitality or retail concentration for place-based growth — rank precincts before committing activation spend.

Hospitality concentration made the investment case obvious to council.

Illawarra Destination Alliance · sample workspace

Live sample workspace

Illawarra Destination Alliance

Tourism & economic development · Illawarra baseline demo

Illawarra regional data · industry-weighted scoring · no sign-in required

Regional map preview

Tourism & local economic development example map

Interactive preview for Illawarra Destination Alliance — Illawarra regional data with industry-weighted scoring. This map is separate from every other industry demo.

Best on desktop — open full screen on your phone for a summary view, or book a live demo for the interactive map.

preview / demo-tourismOpen full screen →

Map-only preview · Open in new tab

See the product

Give MapOps a tourism & local economic development territory question. Get a plan your team can run.

Rank markets, model the pipeline, assign prospects on a street map, and share a local story with each account — without a separate CRM project or GIS stack.

Where is visitor spend concentrating?

Ranked markets on a live map

Every SA2 in your region gets an opportunity score from census, climate, commercial density, and your existing footprint. Leadership sees the shortlist on the map and in a sortable rail — with drive time from your depot baked in.

  • Tap a suburb to highlight it on the map
  • Commercial targets and dwellings per area
  • Test now vs validate when you want to sanity-check data
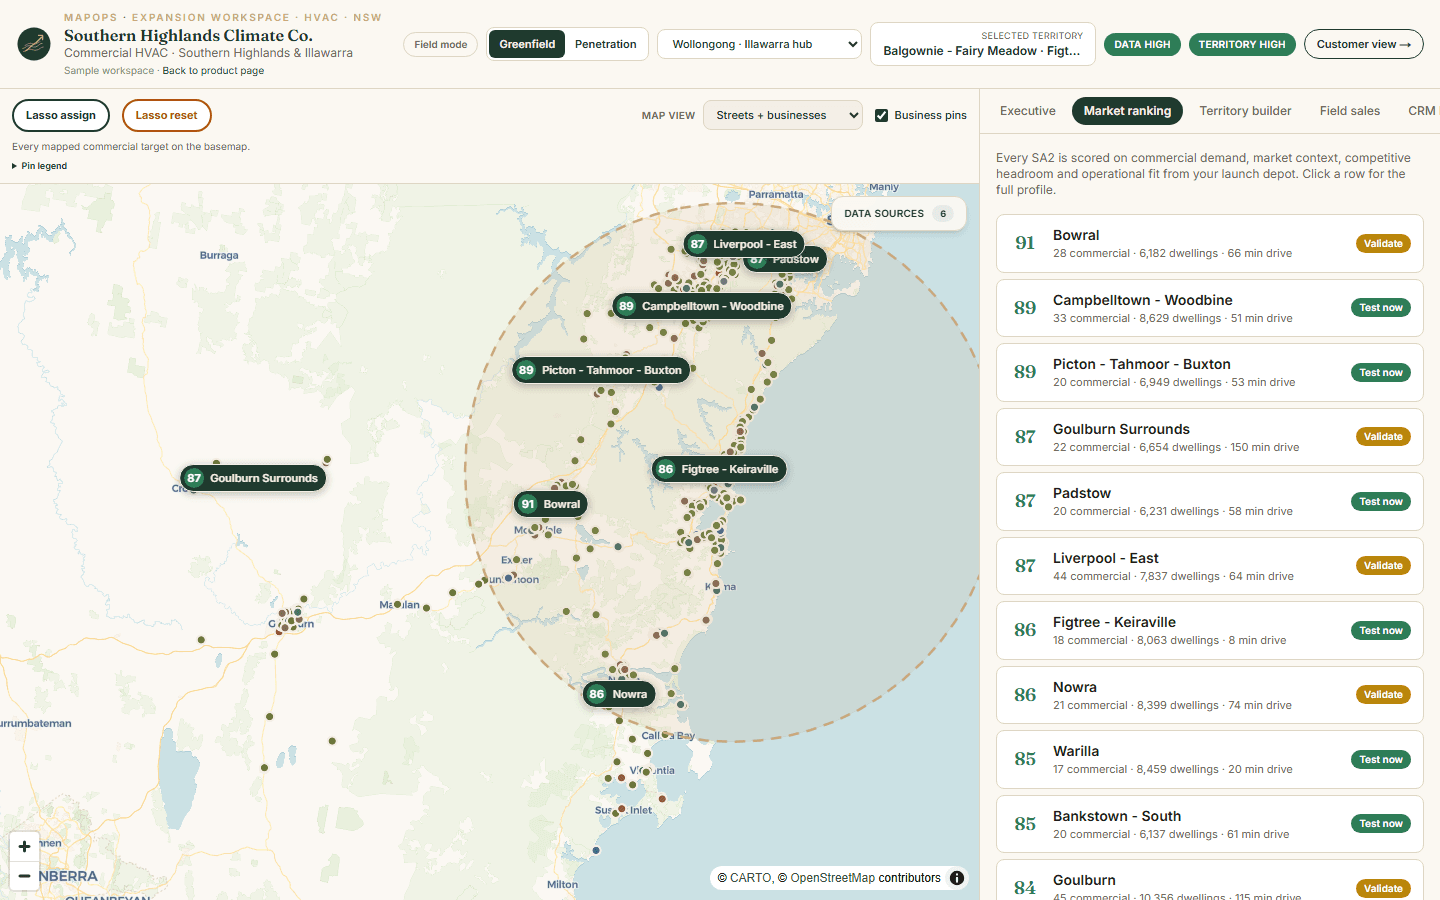
Territory map with ranked market scores and a sidebar list of top expansion areas

What is this patch worth?

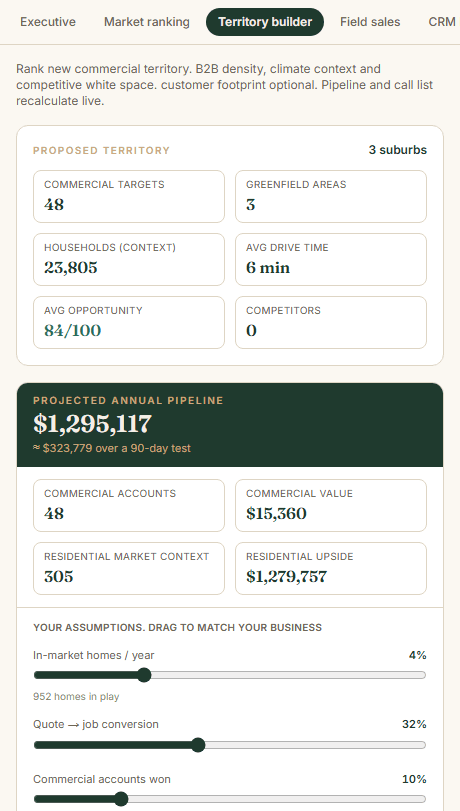
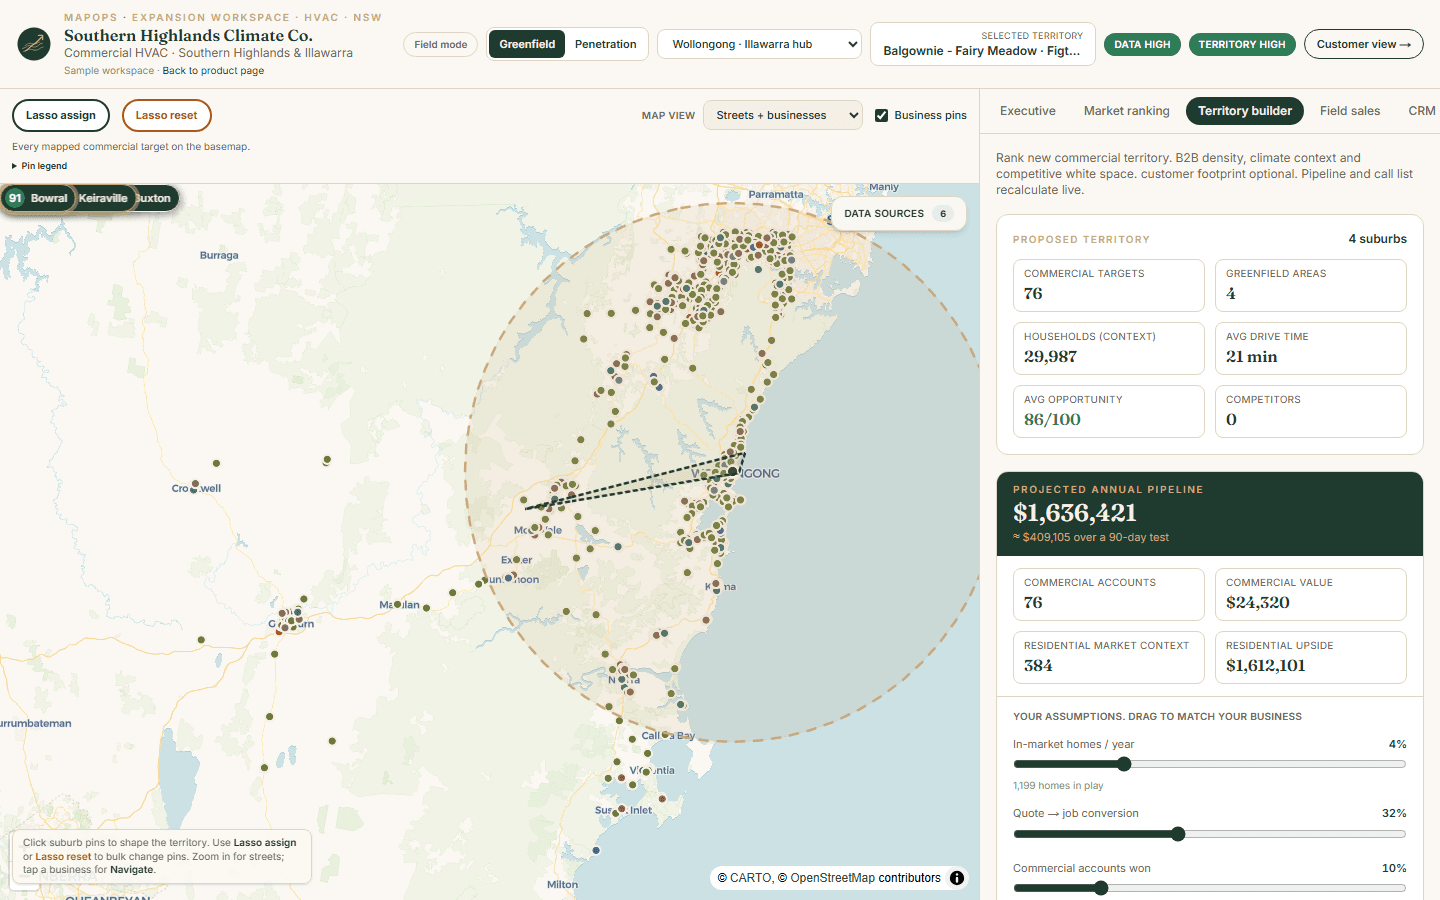
Territory builder with live ROI

Select suburbs to form a trial territory. Commercial target counts, greenfield areas, and competitor density update instantly. Drag your conversion assumptions to match how your business actually closes work.

  • Projected annual pipeline from your inputs
  • Residential context alongside commercial accounts
  • Lock assumptions for a 90-day trial review
Territory summary with commercial targets, projected pipeline, and adjustable business assumptions

Who owns which prospects on the map?

Lasso assign and rep call tools

Draw a pocket on the street map and assign every pin inside to a rep. Each business opens a popup with Navigate, call status, and owner — the same record your leader sees on the team scorecard.

  • Google Maps and Apple Maps directions
  • Outreach status from New through Won
  • Share a prospect-specific story in one tap
Street map business popup with navigate, outreach status, and rep assignment

Is the team actually working the territory?

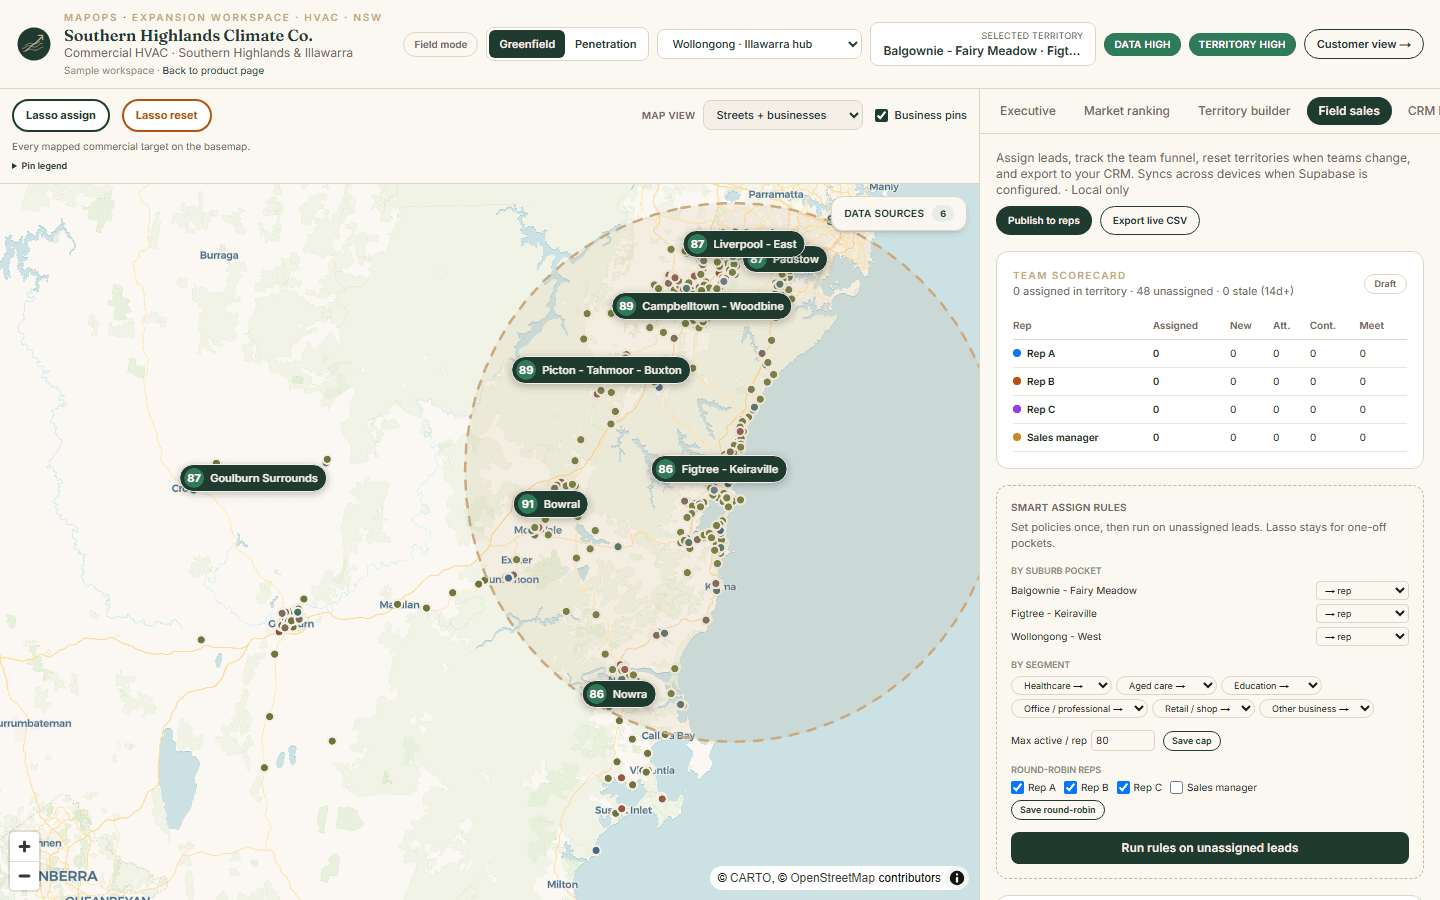
Team scorecard tied to map assignments

Rep rows count the same pins you assigned on the map — not a separate spreadsheet. See assigned vs unassigned in territory, stale leads, and funnel stage per rep while the map shows color-coded ownership.

  • Assigned column matches colored map rings
  • Publish territory when leaders are ready
  • Reset rep or territory when teams change
Team scorecard with per-rep assignment counts beside a color-coded territory map

What do we send the prospect before we visit?

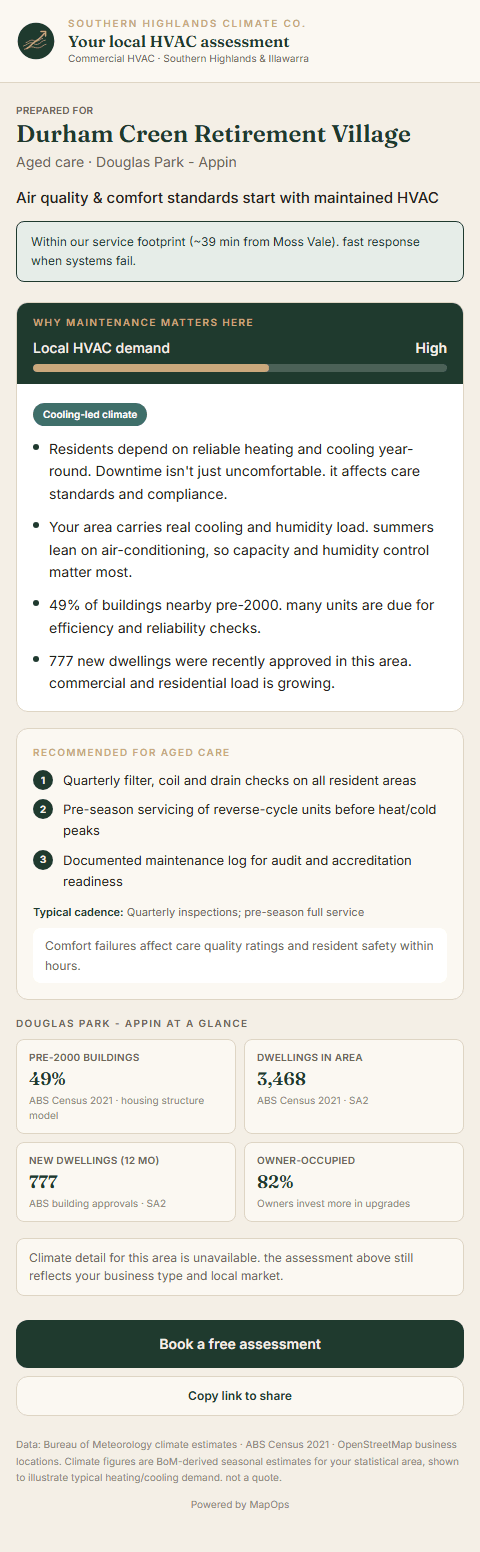
Shareable prospect story

Turn any mapped account into a customer-facing page: why maintenance matters here, local building stock, climate load, and segment-specific recommendations — with your service footprint and drive time from depot.

  • Prepared for [account name] and suburb
  • Pre-2000 buildings and new dwelling approvals
  • Heating vs cooling load for scheduling
Prospect-facing HVAC assessment for an aged care facility with local demand and climate data

Want to walk through it on your region?

Book a short call. We'll show the same workflow on Illawarra demo data and talk through what a workspace would look like for your depots and team.

Book a demo

MapOps is the company behind the product. Illawarra Destination Alliance is a sample tourism & local economic development business you can click through — it shows what the product looks like in daily use, not MapOps itself.

Company
MapOps
Who you talk to, book a demo with, and work with to get set up.
Product
Expansion Workspace
One place to plan territories, rank markets, run field sales, and export to your CRM. MapOps builds and hosts one workspace per client.
Offering
Tourism & local economic development · NSW
MapOps configured for tourism & local economic development operators in NSW.
Sample
Illawarra Destination Alliance
A fictional business whose workspace you can explore today — to see the product, not to represent MapOps.

How it works

MapOps loads regional data for tourism & local economic development decisions. You bring depots, crews, and optional customer history. Together you get a territory plan the team can run.

  1. 01

    Pick a region

    We load businesses, census, climate, and boundaries once for each region — so you're not starting from a blank map.

  2. 02

    Set up your workspace

    Add your depot, crew limits, and customer file if you have one. Scoring adjusts to where you actually operate from.

  3. 03

    Run a 90-day trial

    Publish the territory, assign prospects, and work from the street map. At day 90, decide whether to expand, shrink, or try somewhere else.

Real data behind the map

Every MapOps region starts with public data — cleaned and kept current for that geography. For tourism & local economic development, we emphasise the signals that matter most:

  • Hospitality & retail business mapping

    Hospitality & retail business mapping

    Regional
  • Non-private dwelling concentration

    Non-private dwelling concentration

    Regional
  • Population growth corridors

    Population growth corridors

    Regional
  • Regional income & SEIFA context

    Regional income & SEIFA context

    Regional
  • Precinct-level competitor / anchor mapping

    Precinct-level competitor / anchor mapping

    Regional

Tourism & local economic development expansion territory planning and deliverables

Getting expansion wrong is expensive — extra drive time, weak leads, hiring before you've tested the patch. MapOps helps tourism & local economic development operators compare suburbs, see competitors, and trial a territory before committing capital.

When we set you up, you get ranked markets, a full territory map, field tools for reps, CRM templates, and shareable prospect pages — built around a 90-day trial so you have a clear moment to decide what happens next.

FAQ

Common questions about tourism & local economic development territory planning and MapOps workspaces.

What data does MapOps use for territory planning?

Each workspace combines open regional data — Hospitality & retail business mapping; Non-private dwelling concentration; Population growth corridors — cleaned for the geography. You can run on public data alone or layer in your customer file when ready.

How is opportunity scored?

Scores are transparent and industry-weighted: market demand, commercial account density, competitive headroom, operational fit from your depot, and optional customer evidence. Every suburb shows the inputs behind the number.

Can I open a live demo before booking a call?

Yes. Each industry has a sample workspace on Illawarra regional data — open the live demo to walk through market ranking, territory builder, field sales tools, and prospect pages.

Is this a separate product for each industry?

No. Expansion Workspace is one product configured per industry, region, and client. Australian HVAC is the most developed offering; other industries use the same workspace layout with industry-specific scoring and copy.

Let's talk.

Tell us where you're trying to grow and where your base sits. We'll walk through the Illawarra Destination Alliance sample workspace and talk through what a configured workspace would look like for your business.

Book a demo

Prefer email? contact@mapops.co